n
anonymousdoortablet/dthelp.nsfembedded-analytics
Protected content
| 248pages | Our help system contains many pages and videos for you to consume. This includes the complete information on how Door Tablet works, all its features and options, and of course the many benefits for your business. Door Tablet School offers many videos too. |
|
 |
| 
Click on images to see them in full screen
215862A74692D67680257DD6007ACAB5Embedded Analytics
From version 10.8 of Door Tablet, Embedded Analytics is offered as the preferred alternative to UA Analytics.
VIDEO: Embedded analytics
Why use Embedded Analytics over Google UA
- No set-up required. UA requires significant setup and as a result most users just ignored it
- Works immediately. Since no set-up is required, as soon as the system is up and running statistics are collected
- Easy to use. Select the areas you want to report on and click "Chart"
- Available to on-prem system without external connections. No internet connection required
 Embedded Analytics
To use Embedded Analytics you must first disable Google UA.
Setting Embedded Analytics
There is no set up to do.
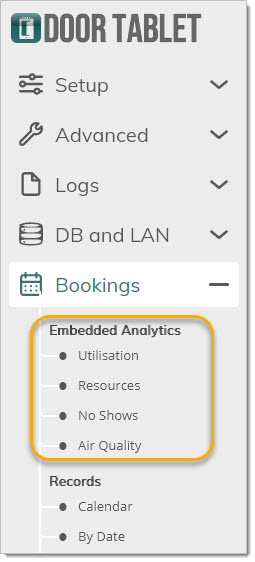
Access
To access the analytics, navigate to Charts:
 Each of the pages will provide for different views
Analytics Types
Each of the pages will provide for different views
Analytics Types
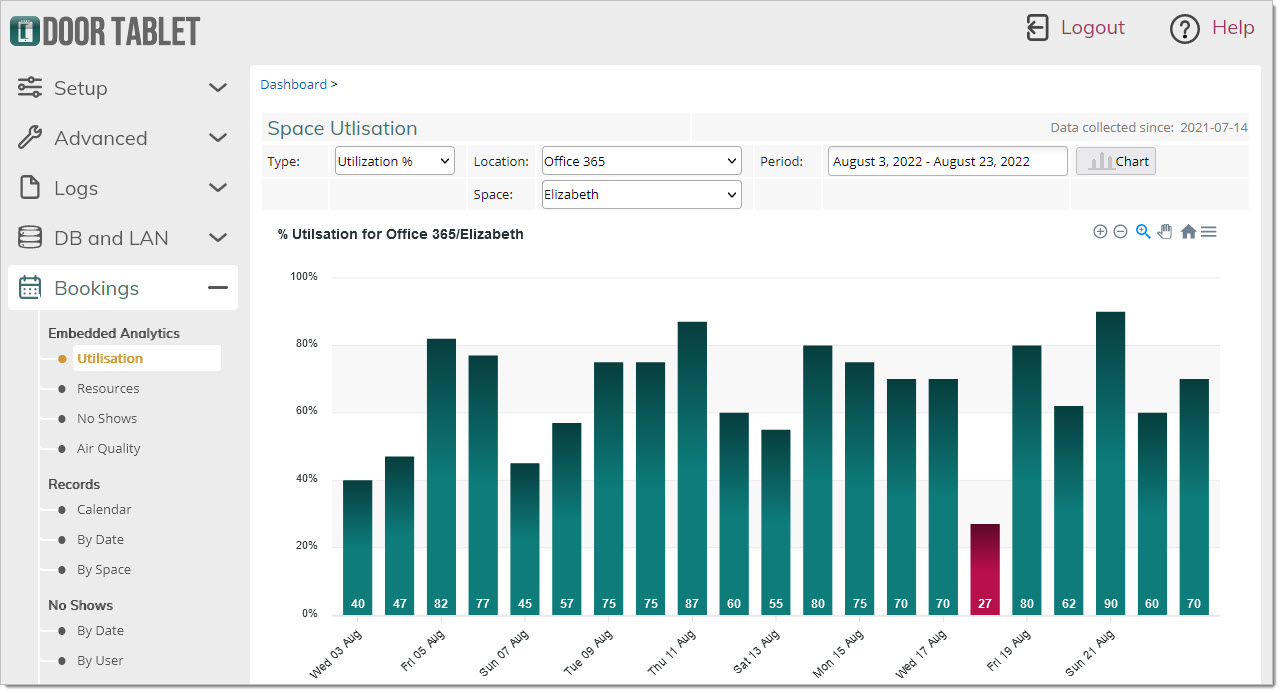
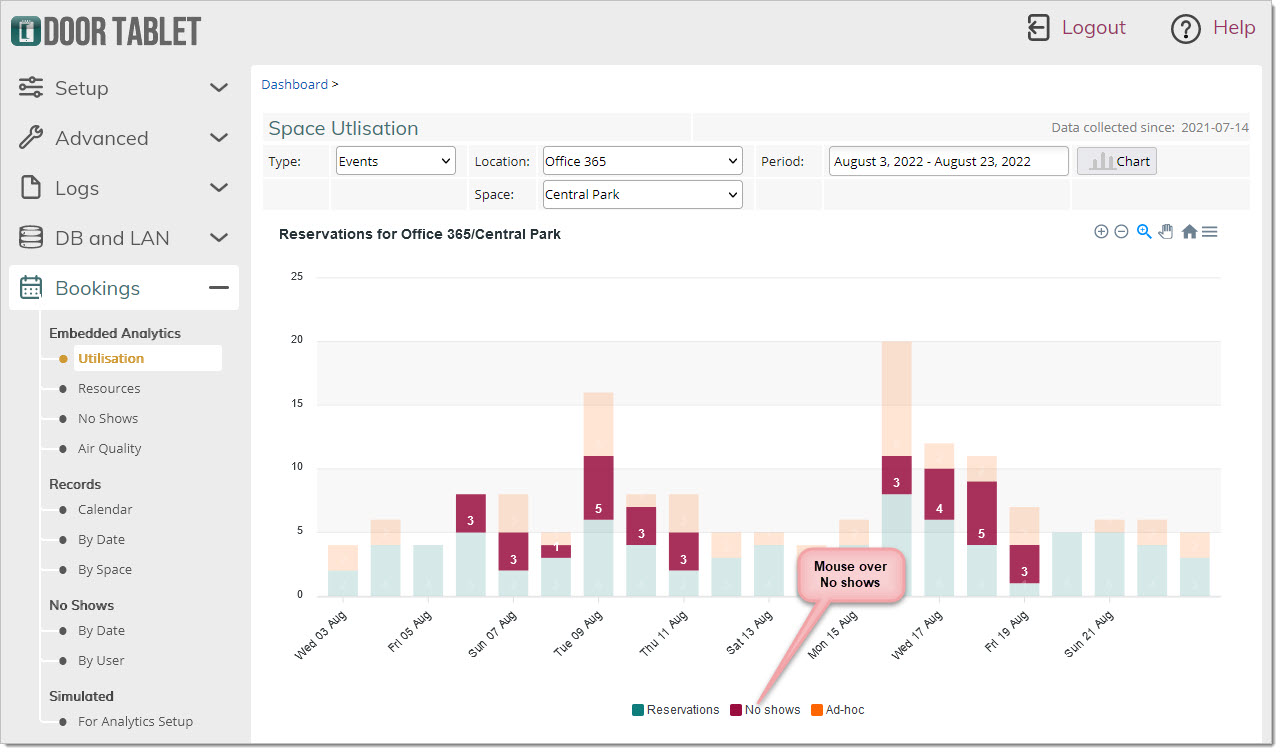
- Utilisation - probably the most common of requirements, the Utilisation page provides information relating to the amount of reservations
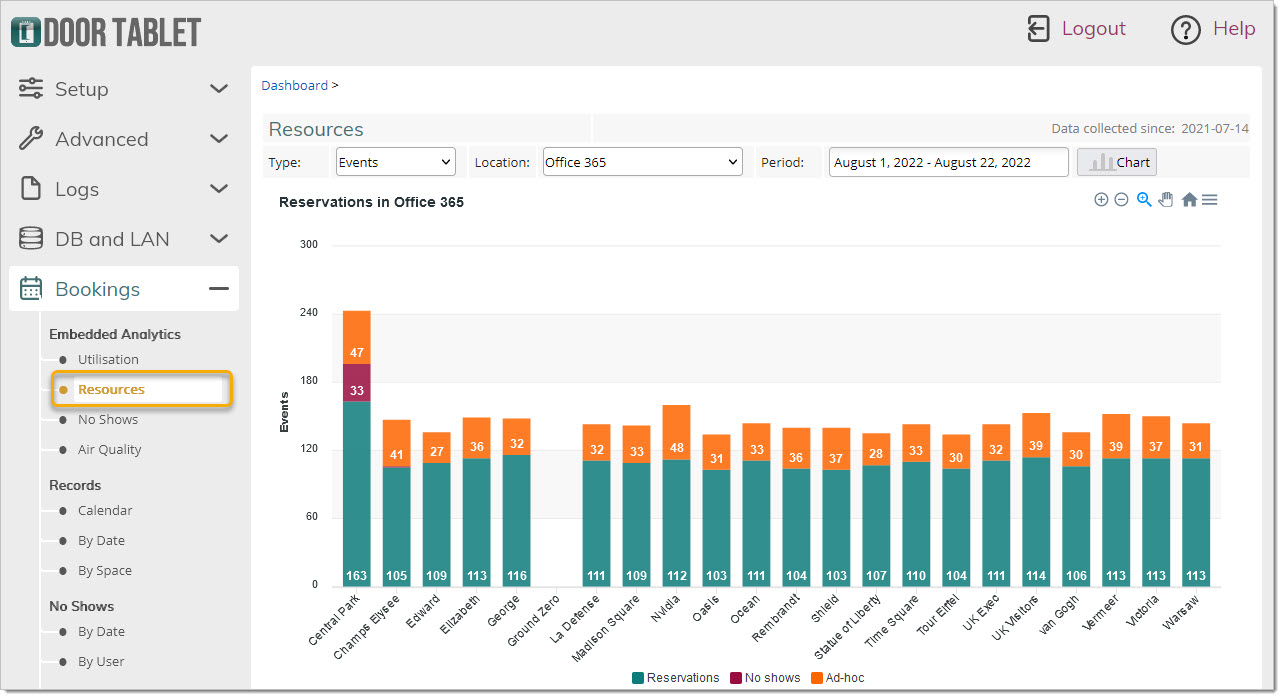
- Resources - examine your utilisation by comparing resources
- No shows - reports on no shows, if these were enabled for your spaces
- Air Quality - if you installed Air Quality and/or CO2 sensors, use this page, too
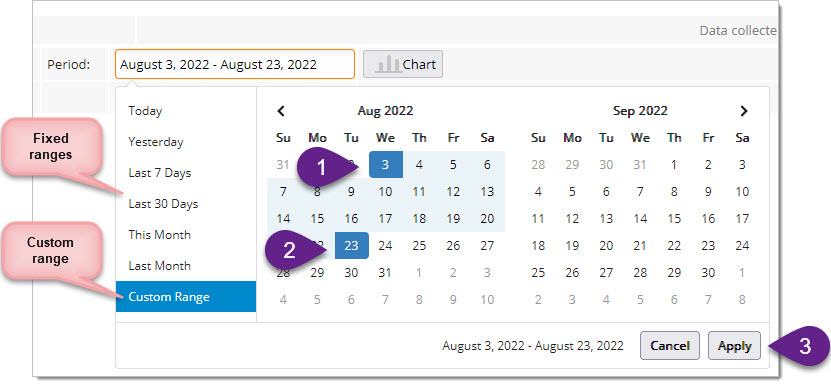
 Selecting a date range
You can select from fix ranges or a custom range. When selecting a custom range, click on the first day, then the last day. When done, click on Apply.
Selecting a date range
You can select from fix ranges or a custom range. When selecting a custom range, click on the first day, then the last day. When done, click on Apply.
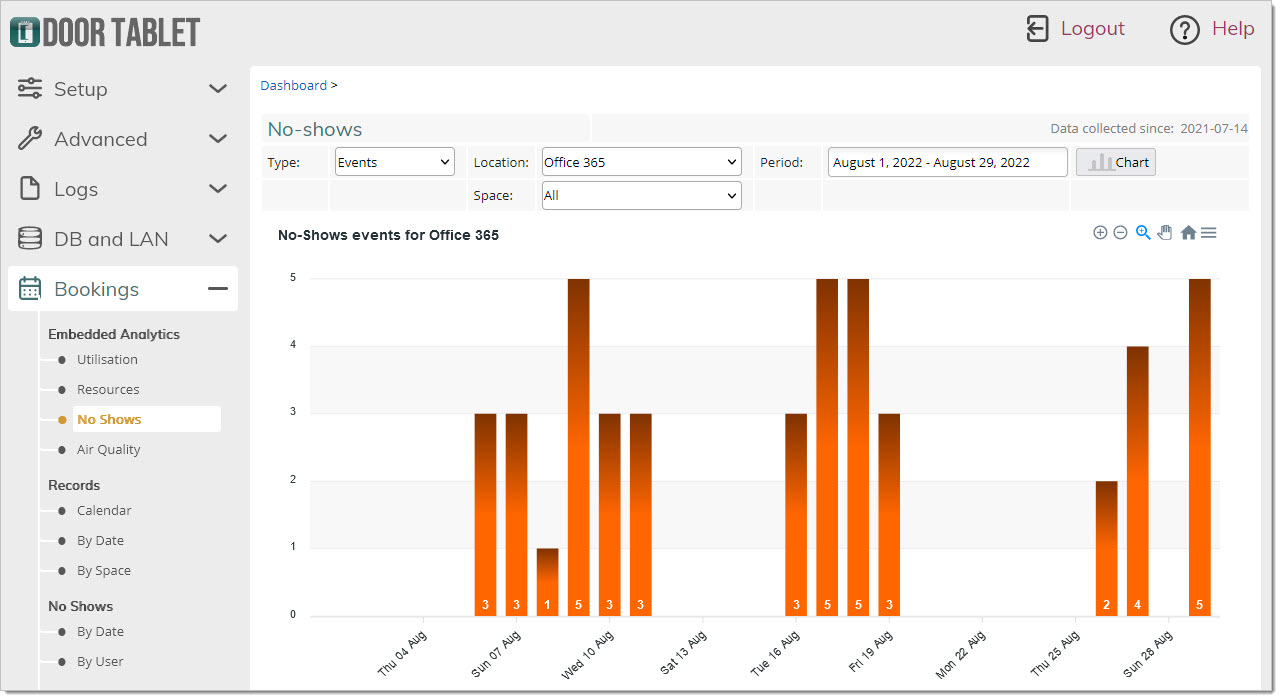
 Data collection
The Door Tablet server add-in collects you data during the day and at the end of each day. The data is summarised and becomes available to Embedded Analytics on a daily basis. Please note that this page shows when the data collection has started:
Data collection
The Door Tablet server add-in collects you data during the day and at the end of each day. The data is summarised and becomes available to Embedded Analytics on a daily basis. Please note that this page shows when the data collection has started:
 If you just started to use this version you will no see historical data however, if you have upgraded your system from mid 2021 data collection would have started and you should be able to report since that date.
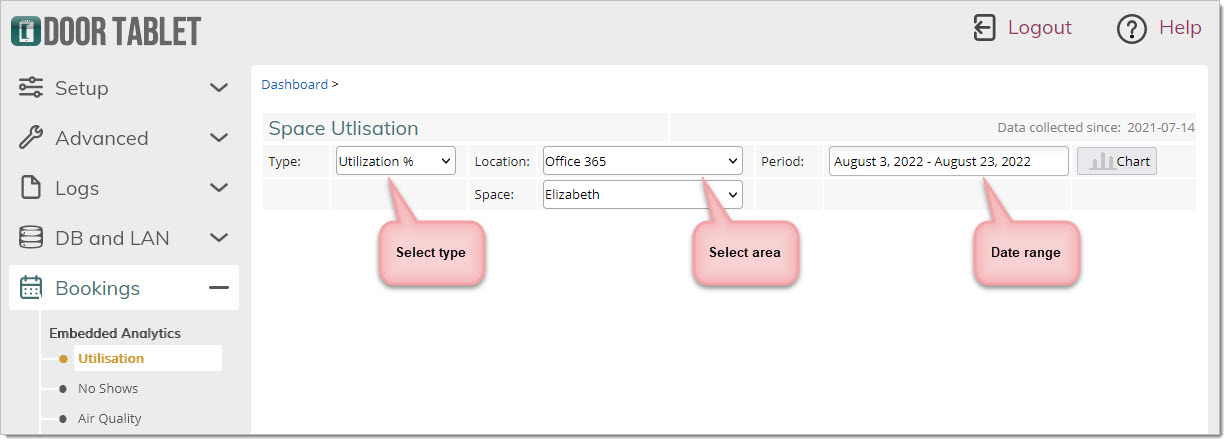
Ready to chart?
Click on the chart button to see your report...
If you just started to use this version you will no see historical data however, if you have upgraded your system from mid 2021 data collection would have started and you should be able to report since that date.
Ready to chart?
Click on the chart button to see your report...
 OR
OR
 OR
OR
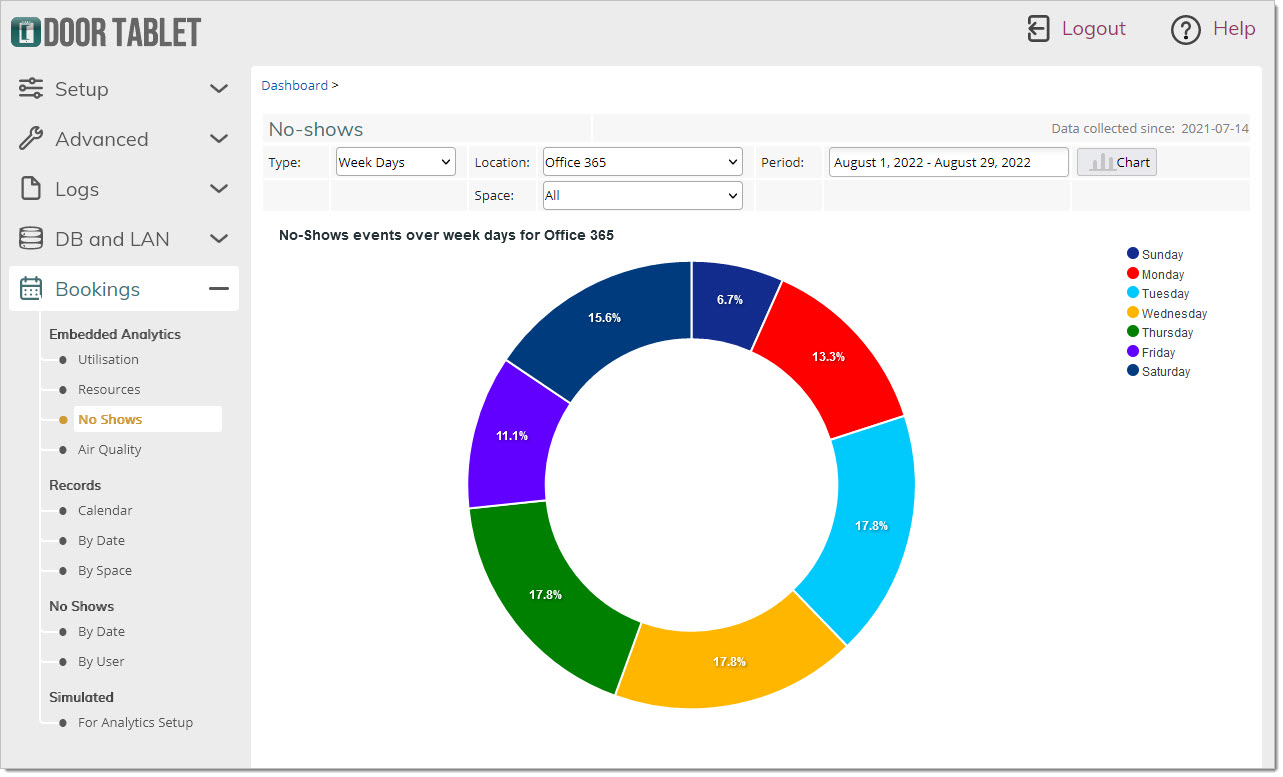
 On reports which show a legend you can roll the mouse over to see just the items you are interested in:
 Resource reports
These reports compare the performance of resources within the same area for the same time period.
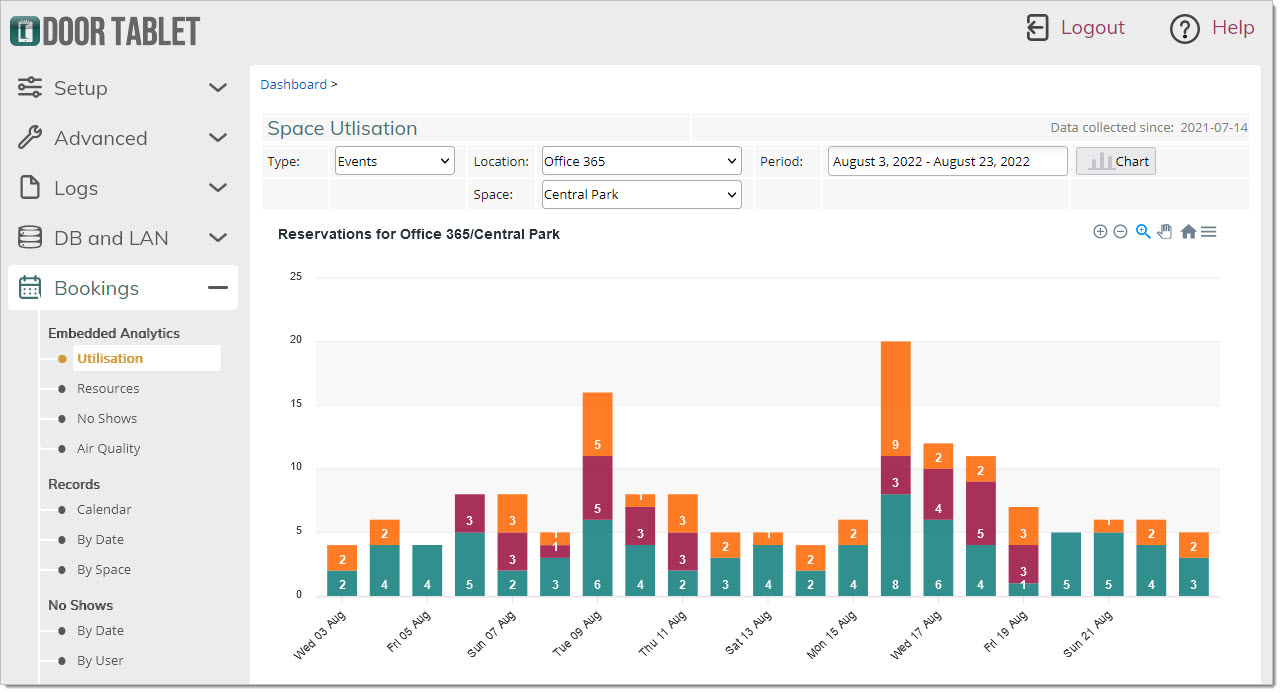
Show the type of event recorded on the system...
Resource reports
These reports compare the performance of resources within the same area for the same time period.
Show the type of event recorded on the system...
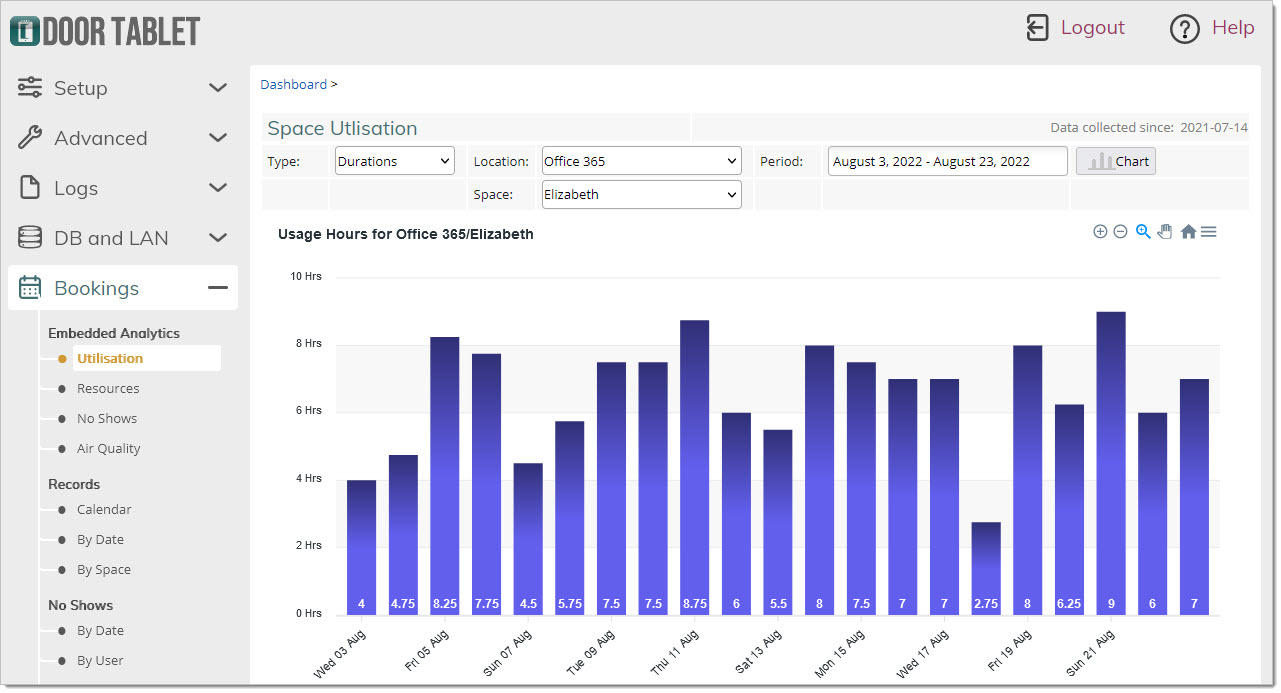
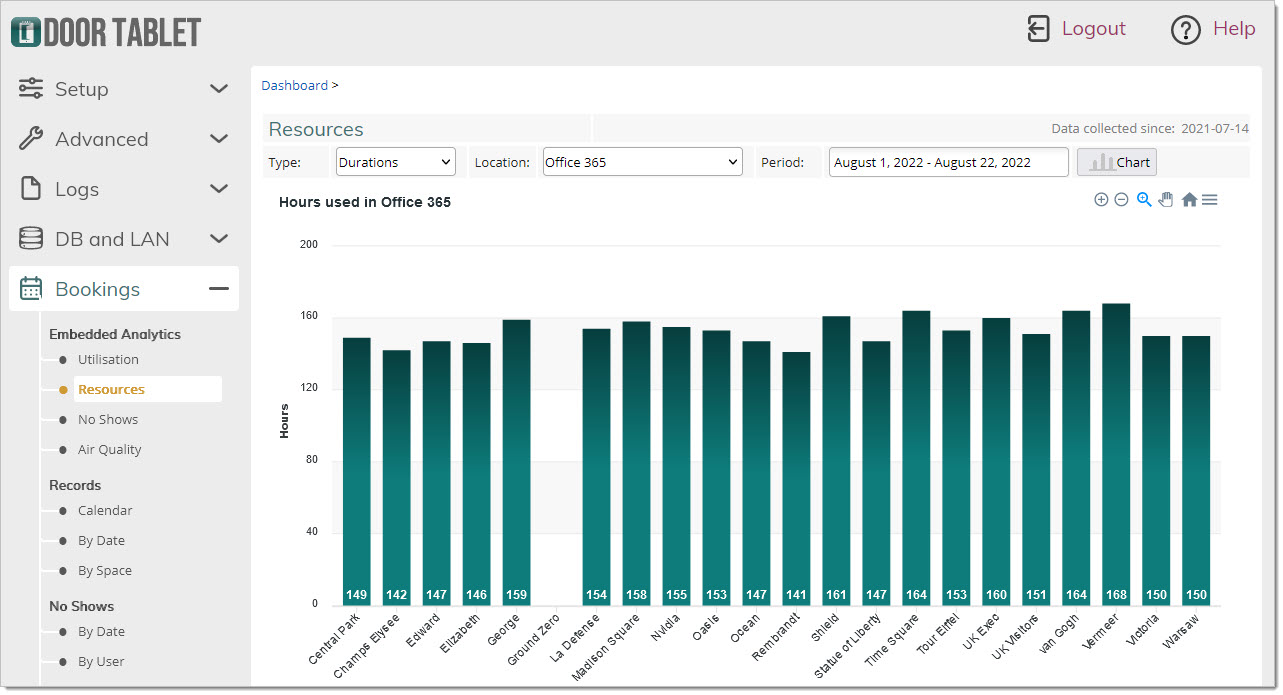
 The duration in hours used by each of the resources during the period:
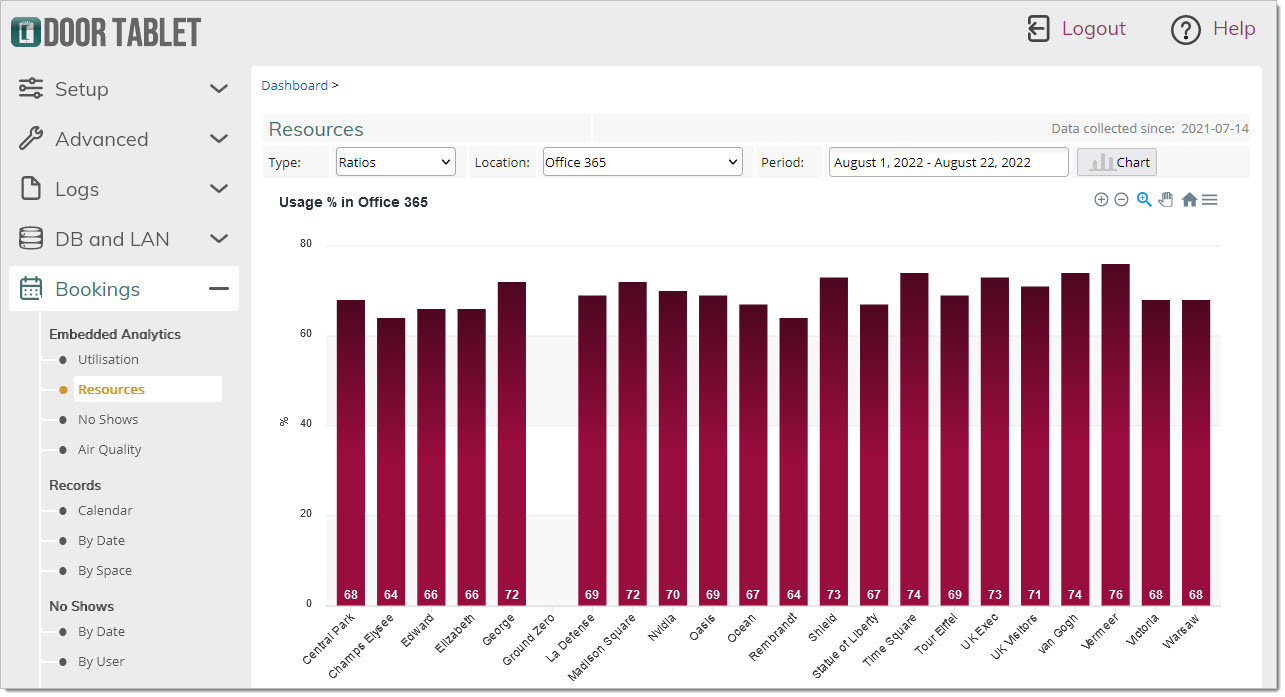
 Now show the % usage of the same resources:
 No-show reports
These reports show the no-show events for statistical purposes. To view named hosts that failed to show, and not check-in, use the specific no-show reports under bookings.
No-show reports
These reports show the no-show events for statistical purposes. To view named hosts that failed to show, and not check-in, use the specific no-show reports under bookings.
 OR
OR