How many of your meeting rooms sit empty on a Wednesday morning? Which ones are booked solid, but half the time no one shows up? Do people avoid that corner conference room because it’s too far from the lifts or because the air feels stale by 3 pm?
If you can’t answer those questions, you’re not alone. Too many workplace and IT teams are still making million-pound decisions based on complaints, gut instinct, or the occasional lap around the floor.
If you don’t have meeting room tablets, you’re guessing. You don’t know which spaces sit empty half the week or how many hours vanish into ghost bookings.
And if you
do have tablets? Chances are you’re only scratching the surface. Many organisations use them as glorified “booked/free” signs - helpful, but missing the bigger prize. Every booking, every no-show, every overrun or cancellation is data waiting to be captured. Tablets aren’t just signage; they’re analytics engines.
This article is about that untapped value. Why meeting room analytics matter more than ever, what they reveal about your space, and how the data hidden inside your tablets can turn guesswork into clarity.
1. You Can’t Fix What You Don’t See
Every conference room has a meeting scheduled on the calendar, yet you notice a few rooms are dark and empty. Is it a fluke, or a pattern? Without analytics, you simply wouldn’t know. This is the classic scenario of a
blind spot in workplace management. You can’t fix a problem you don’t see, and without data, a lot remains unseen. Many workplace teams rely on anecdotal feedback (“the large boardroom is always booked!”) or occasional headcounts, but lack hard numbers on how spaces are actually used.
For example, one
Gartner study revealed up to
30% of meeting room bookings are “ghost meetings,” reserved but with nobody showing up. That’s nearly a third of conference room time potentially wasted – a massive inefficiency that stays invisible if you’re only looking at calendars and not utilisation data.
In reality, sensors and utilisation reports often find a significant gap between bookings and actual usage, on the order of
20–30% in many organisations. Without shining a light on these no-shows, companies keep building more meeting rooms or assume space is fully utilised, when in fact a good chunk of reserved time is going unused.
Blind spots extend beyond ghost meetings. Consider space utilisation:
Is your average meeting room used 10% of the workweek or 50%?
It’s all too common for workplace leaders to
overestimate usage based on peak moments (“Every Tuesday at 11 am we’re packed, so all rooms must be heavily used”) or to
underestimate chronic issues (like one team monopolising a particular room). In a Leesman survey,
93% of real estate leaders said they measure basic office occupancy, but only 9% were using advanced sensor data for granular insights, which means most were likely missing the nuances in how different rooms and days are utilised.
You can’t manage what you don’t measure.
A facilities manager might sense that Fridays are quieter or that a certain floor’s meeting rooms are underused, but without numbers, it’s hard to justify changes.
You
could improve meeting room allocation, adjust cleaning and HVAC schedules to actual use patterns, or repurpose underutilised space… but only if you have the visibility.
The first step to improvement is acknowledging the need for visibility. This is where meeting room tablets come in, acting as a bridge between the physical workspace and digital analytics.
2. Meeting Room Tablets: The Data Behind the Display
When you see a tablet mounted by a meeting room door, you might think of it simply as a digital sign, a convenient way to display the room’s schedule or allow quick bookings. But modern
meeting room tablets are much more than glorified signs. They are, in fact, powerful data-gathering sensors and interfaces, the front door to a wealth of workspace analytics. These devices log every interaction: when a meeting is scheduled, when someone checks in, if a meeting ends early or overruns its slot, and when the room goes idle.
Many meeting room tablets also connect to
additional sensors. Motion sensors, for example, can detect whether people actually entered the room for a booked meeting. If the tablet doesn’t detect motion (or a manual check-in on screen) within a set timeframe, it can automatically mark the room as free again – essentially outing the ghost meeting and freeing the space for others.
In effect, the tablet is acting like a vigilant concierge, ensuring the schedule reflects reality. Without a tablet or sensor, a ghost meeting would go undetected (the room stays “booked” on the calendar while sitting empty). With a tablet, that ghost is busted, the room becomes bookable again, and the incident is logged in the data as a meeting that was booked but not attended.
Beyond motion,
consider environmental data. Many modern workplace tablets or their accessories can monitor conditions like temperature, humidity, air quality (CO₂ levels, VOCs), and light. Door Tablet, for instance, offers
health sensors that track CO₂ and air quality in each room. Why does this matter?
Because environmental comfort is a key part of workspace performance. If a meeting room is too stuffy or too cold, people will avoid it (or complain if they have to use it). In fact, temperature and air quality are consistently among the top workplace complaints -
surveys have found that temperature is the number one office complaint employees raise, often surpassing noise.
A
Harvard Healthy Buildings study found that
for every 500 ppm increase in indoor CO₂, employee response times slow by about 1.4–1.8%, with correspondingly lower cognitive performance. In practical terms, a poorly ventilated meeting room can literally make your team sluggish. A tablet tied into environmental sensors makes those invisible factors visible. You could use that data to adjust HVAC settings, add air purifiers, or simply understand why certain rooms get a bad reputation.
These meeting room tablets also serve a
dual role: not only gathering data, but also engaging employees to
influence behaviour. The tablet’s presence reminds people to check in for meetings (accountability), to free up the room if they finish early, or to book a space on the spot if they need one. Visual cues like the green/yellow/red availability lights instantly tell employees if a room is free without having to crack open a laptop. They even help prevent the age-old problem of conference room squatters or thieves – nobody wants to grab a room that’s clearly marked as reserved on the display for someone else’s meeting.
Knowing what to look for and what to do with it is where the magic happens, after all; capturing data is only half the battle. Let’s break down the specific metrics and insights that the best teams track once they have this data firehose open.
3. Making the Most of Door Tablet’s Embedded Analytics
Let’s zoom in on Door Tablet as an example of how embedded analytics in meeting room tablets work. Door Tablet is a conference room scheduling solution (with both software and supported hardware) that, beyond just facilitating bookings, provides a robust analytics component. If you’re already using Door Tablet, you might have heard about its Google Analytics integration or seen some of its dashboards. If not, this will still illustrate what a modern system can do.
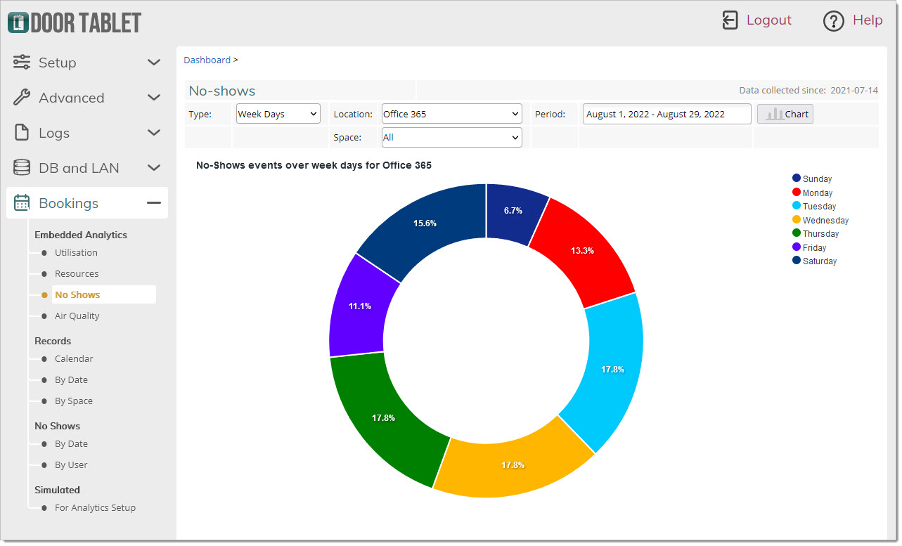
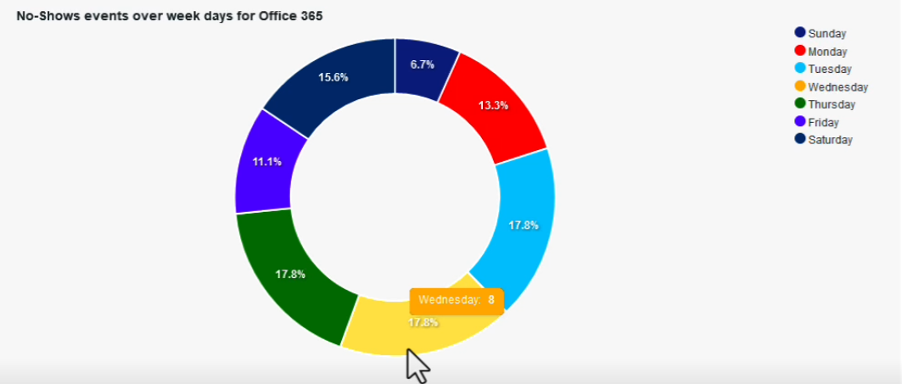 Chart showing weekly no-show meetings. Use Door Tablet to identify how many meetings are ghost meetings
.
Embedded Analytics: A standout feature of Door Tablet is its embedded analytics, meaning you don’t need to connect to an external platform like Google Analytics. From the moment the system is running, it automatically collects key statistics such as room utilisation, resource allocation, no-show rates, and even environmental data like air quality (if sensors are installed). Reports are instantly available with no set-up required, just choose the area you want to analyse and generate a chart. Because analytics are embedded directly into the platform, IT teams and facility managers can view performance metrics in real time without relying on internet connections or third-party tools.
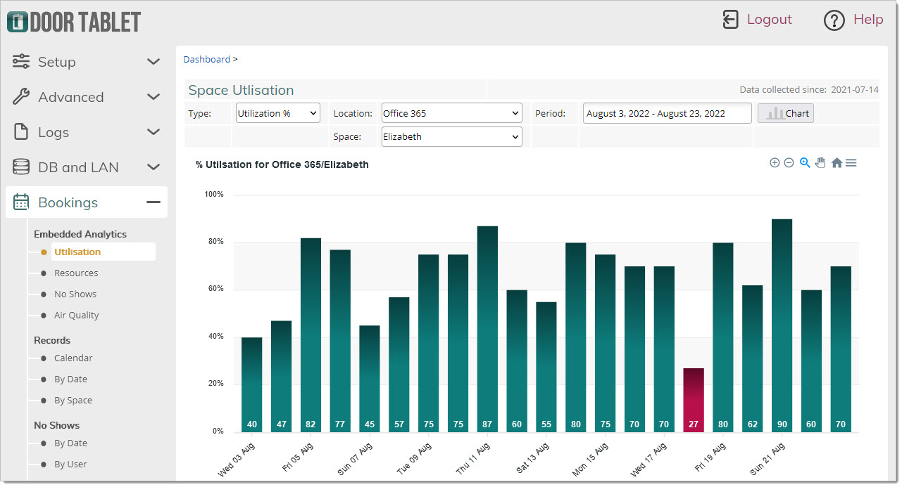
 Dashboard Sample
What Insights Does it Provide?
Once the data is flowing, what can you see? Door Tablet’s analytics are designed to answer exactly the questions we outlined in the previous section. The system can generate reports on all of the following and more:
- Room utilisation percentage: For each space, what percentage of bookable hours it’s actually occupied. For example, you might pull up a report and see: “Room 12A – 52% utilised last week, vs 47% the week before.” This helps track trends and identify under-/over-utilised rooms at a glance.
- Number of meetings aborted (no-shows): It explicitly counts meetings that were scheduled but never checked into. These would be the ones Door Tablet cancelled automatically for no-show or that were otherwise marked as not happening. You could rank rooms by no-show count or see how no-shows as a percentage of bookings change over time (perhaps after implementing new policies).
- Meeting duration distribution: The system can categorise your meetings by length – short vs. long. For example, it might show you that 40% of your meetings last 15 minutes or less, 45% are 30 minutes, 10% an hour, and 5% over an hour. This could validate if people are actually using the short meeting options or if everything defaults to an hour.
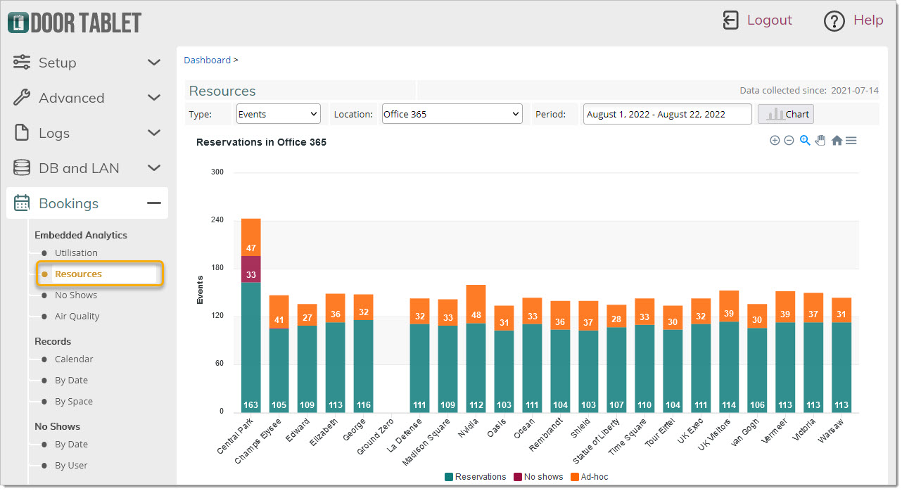
- Comparisons across spaces and locations: If you have multiple rooms, zones, or offices, the analytics will highlight which areas perform better than others. For instance, “Building A’s meeting rooms average 50% utilisation, whereas Building B (satellite office) only 20%.” Or at a micro level, “The 3rd floor rooms are used twice as much as the 2nd floor rooms.” Door Tablet even allows roll-ups by city or country, which is useful for global companies to see which offices have higher meeting density.
- Time comparisons: The platform supports month-on-month and year-on-year comparisons of utilisation. This is incredibly useful to spot seasonal trends (does usage dip in July/August and December? Likely yes) and to measure improvements after changes. If you undertake a “workspace optimisation project” in Q1 and then compare utilisation in Q2 vs. last Q2, you can see if the needle moved.
- Targets and benchmarks: Door Tablet can help you set a target (say, aim for 50% utilisation in all huddle rooms) and then identify which rooms are lagging (maybe a particular room is at 20%, flagging it for investigation).
 Dashboard Sample
Tailoring Door Tablet to Your Workplace Needs
Making the most of embedded analytics also means configuring the system optimally. You decide what counts as a no-show (e.g., no check-in within 10 minutes), what the office’s bookable hours are, and how recurring meetings are handled.
One more cool aspect:
visualising environmental data alongside usage (optional). Door Tablet’s
sensor integrations mean you could potentially see a chart of CO₂ levels in a room throughout the day alongside its occupancy. For example, a conference room might show rising CO₂ during a long afternoon meeting, peaking above recommended levels, which correlates with participants reporting feeling drowsy. Having that chart empowers facility teams to intervene, perhaps by scheduling an extra ventilation flush at noon, or by limiting that room’s capacity for long meetings.
Conclusion: Goodbye Guesswork, Hello Clarity
Offices are too costly to run on gut feel. Meeting room tablets like Door Tablet turn opaque space usage into clear, actionable data. For teams without tablets, analytics should be the reason to start. For those already using them, the value lies in moving past “booked/free” and unlocking the insights already being collected.
Every underused room, every ghost meeting, every stuffy conference space is a solvable problem if you can see it. Analytics make that possible. The difference between guessing and knowing is the difference between wasted space and a workplace that works.
Key Takeaways
- Visibility is everything. Without analytics, up to 30% of bookings can be ghost meetings, wasted space that stays hidden if you only rely on calendars.
- Meeting room tablets are data engines. They capture utilisation, no-shows, duration, attendance, and even comfort levels, turning the invisible into clear insights.
- Track the metrics that matter. Utilisation rates, peak times, ghost bookings, meeting duration, and environmental comfort are the levers that help IT and workplace teams optimise space.
- Door Tablet helps you get started. Beyond dashboards and GA4 integration, Door Tablet offers a library of how-to videos so teams can learn step-by-step how to unlock analytics.